Getting Richer or Poorer? Why the Numbers in Your Bank Account Don’t Always Tell the Truth
Richer or Poorer? Why Your Bank Balance Can Be Misleading
📌 TL;DR
In this post, I try to reassess my net worth in terms of real assets and goods — housing, gold, oil — instead of just looking at nominal amounts in kroner. For the calculations, I use annual data from my Skatteoppgjør and compare it to market prices of key resources over the past 10 years.
Introduction
The other day I came across a Facebook post in the “Norway. Money” group — “The Illusion of Wealth” by Aleksandr Shcherbakov.
In a world of endless money printing, there’s a growing sense of wealth. But if you start tracking your net worth in square meters, stocks, gold, or barrels of oil, you’ll realize it’s an illusion — you’re actually getting poorer.
I had never thought about my capital from that angle before. And I got curious — what would happen if I applied this logic to my own assets?
At first glance, our capital seems to grow. Salaries get indexed, savings increase, and the numbers on our bank accounts look more and more comforting.
But what happens if we measure that growth in real assets — square meters of housing, ounces of gold, or barrels of oil?
Maybe our sense of wealth… is just an illusion.
“Formuesverdi” and Nominal Growth
In Norway, the term formue refers to the official measure the government uses to calculate wealth tax. In your tax return, you’ll find the line formuesverdi for assets: property, bank accounts, stocks, and other holdings. But does this number actually reflect real wealth?
Many of us feel reassured when we see growing numbers in our tax reports or online bank accounts. Property in Oslo is officially “worth more,” your account balance has increased, and your pension fund (through KLP, DNB, etc.) is showing gains.
It creates a sense of financial progress. It feels like we’re getting richer.
But there’s a catch: this growth is often nominal — measured in kroner that lose purchasing power over time. If we don’t account for inflation and rising prices of real assets, we risk fooling ourselves. Being “richer” in kroner doesn’t necessarily mean you can afford more.
A more accurate way to assess wealth is to measure it in tangible terms:
- How many square meters of housing can you buy?
- How many ounces of gold or barrels of oil is your capital worth?
Once we change the unit of measurement, the illusion can disappear fast.
Why It Matters to Recalculate Wealth in Real Goods
When we talk about growing wealth, we usually mean growth in our national currency — in this case, Norwegian kroner.
But money isn’t an absolute unit of measurement. Its purchasing power changes — and sometimes, quite rapidly.
Take a look at this chart from Gull & Penger, which shows the price of 1 square meter of housing in Norway, not in kroner, but in grams of gold:
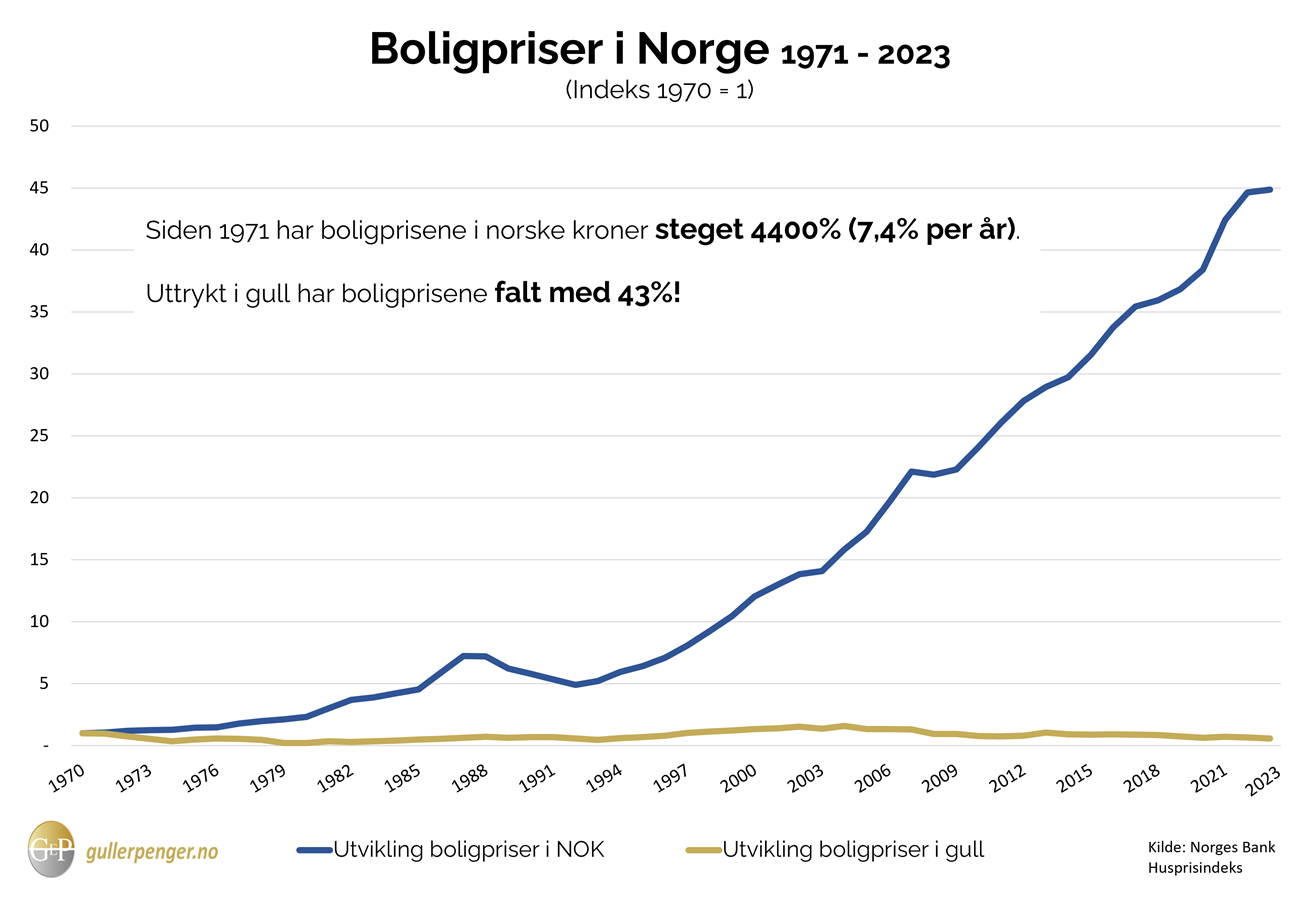
At first glance, it may seem like housing prices are rising steadily. But when you recalculate the price per square meter in gold — one of the most stable stores of value across centuries — you’ll see that since 2008, Norwegian real estate has actually become cheaper in “gold terms.”
What Does This Mean?
It means that if you had held your capital in gold instead of kroner back in 2008, today you could afford more square meters of housing.
Your real wealth — measured in gold — would have increased, despite rising nominal prices in kroner.
Conversely, if you simply kept your money in the bank in NOK, you may be “richer” on paper — but your purchasing power relative to real estate has actually declined.
Currency Is Not a Measure — It’s a Variable
We’re used to measuring everything in money — in kroner, dollars, euros. It’s convenient because money is everywhere; it’s the universal medium in the economy.
But there’s one issue: currency itself is unstable. It’s subject to inflation, manipulated by governments and central banks, and gradually loses its purchasing power over time.
Put simply, if you store your wealth in kroner, you’re measuring it in a moving target — a variable that keeps depreciating.
What Happens to Money?
- Central banks print money to stimulate the economy.
- Inflation reduces the purchasing power of that money.
- Interest rates, currency exchange rates, and government policy further affect the “price of money.”
One of the most striking examples is the U.S. response to the COVID-19 pandemic. The Federal Reserve dramatically increased the money supply to “support the economy.” You can see it clearly in the chart below:

The chart shows how the amount of dollars in circulation literally spiked in 2020. This isn’t just a number — it reflects the real dilution of value across all existing dollars.
If $100 used to buy you a certain basket of goods, after trillions were injected into the economy, that same $100 now buys less. Your savings in dollars lost value — even if the amount in your account stayed the same or even increased.
Similar dynamics affect other currencies as well — including the Norwegian krone.
Example
If in 2015 you could afford 10 m² of housing in Oslo with your savings, but by 2025 — only 6 m², then you’ve objectively become poorer — even if your bank account shows a “+40%” increase.
Let’s Try to Analyze Our Net Worth
Here’s what the picture looks like:
| Year | Gold (NOK/oz) | Oil (NOK/barrel) | Oslo Housing (NOK/m²) | Nettoformue | Gold | Oil | Square Meters |
|---|---|---|---|---|---|---|---|
| 2014 | 9,005.00 | 453 | 54,112 | ||||
| 2015 | 9,790.00 | 328 | 60,528 | ||||
| 2016 | 10,000.00 | 463 | 70,585 | ||||
| 2017 | 10,615.00 | 533 | 75,781 | ||||
| 2018 | 11,071.00 | 486 | 76,281 | ||||
| 2019 | 13,688.00 | 596 | 78,861 | ||||
| 2020 | 15,500.00 | 436 | 83,304 | ||||
| 2021 | 15,865.00 | 669 | 92,213 | ||||
| 2022 | 18,681.00 | 798 | 96,955 | ||||
| 2023 | 21,061.00 | 830 | 97,949 | ||||
| 2024 | 29,980.00 | — | 102,899 |
Now we can add one more column — Nettoformue, to track your actual net worth.
You can find this value in your Skatteoppgjør for the corresponding year. Ideally, collect this data for the full 10-year span.
Then, calculate nettoformue using the following simplified formula:
Nettoformue = Sum of gross assets − Total debt (for both spouses, before deductions) + Adjustment for deductible debt due to valuation discounts (if any)
(Norwegian) Nettoformue = Sum bruttoverdi formue − Sum gjeld (обоих супругов) до учёта скидок + Reduksjon av fradragsberettiget gjeld på grunn av verdsettingsrabatt(если есть какие-то скидки)
Once calculated, you can convert your nettoformue into real goods — gold, oil, or square meters of Oslo housing.
For clarity, it makes sense to plot a graph that visualizes how your purchasing power has evolved over time.
Disclaimer
The formula used in this post to calculate nettoformue is simplified and intended for illustrative purposes only. It may not reflect all tax nuances and can differ from the official Skatteetaten calculations.
Gold
Gold is often seen as a safe investment, but if you look at its price over the last 100 years, it becomes clear that it’s also subject to volatility. After the gold standard was abolished in 1971, the price of gold surged and peaked in 1980 — but what followed were two decades of decline and stagnation. Investors who bought at the top had to wait nearly 30 years for prices to recover.
A new upward trend began in the 2000s, with a sharp increase during the 2008 financial crisis and especially during the pandemic, when gold reached historic highs in 2024–2025. This chart shows clearly that even “safe haven” assets like gold don’t guarantee steady growth — they go through cycles, and recovery after a major surge can take a long time.
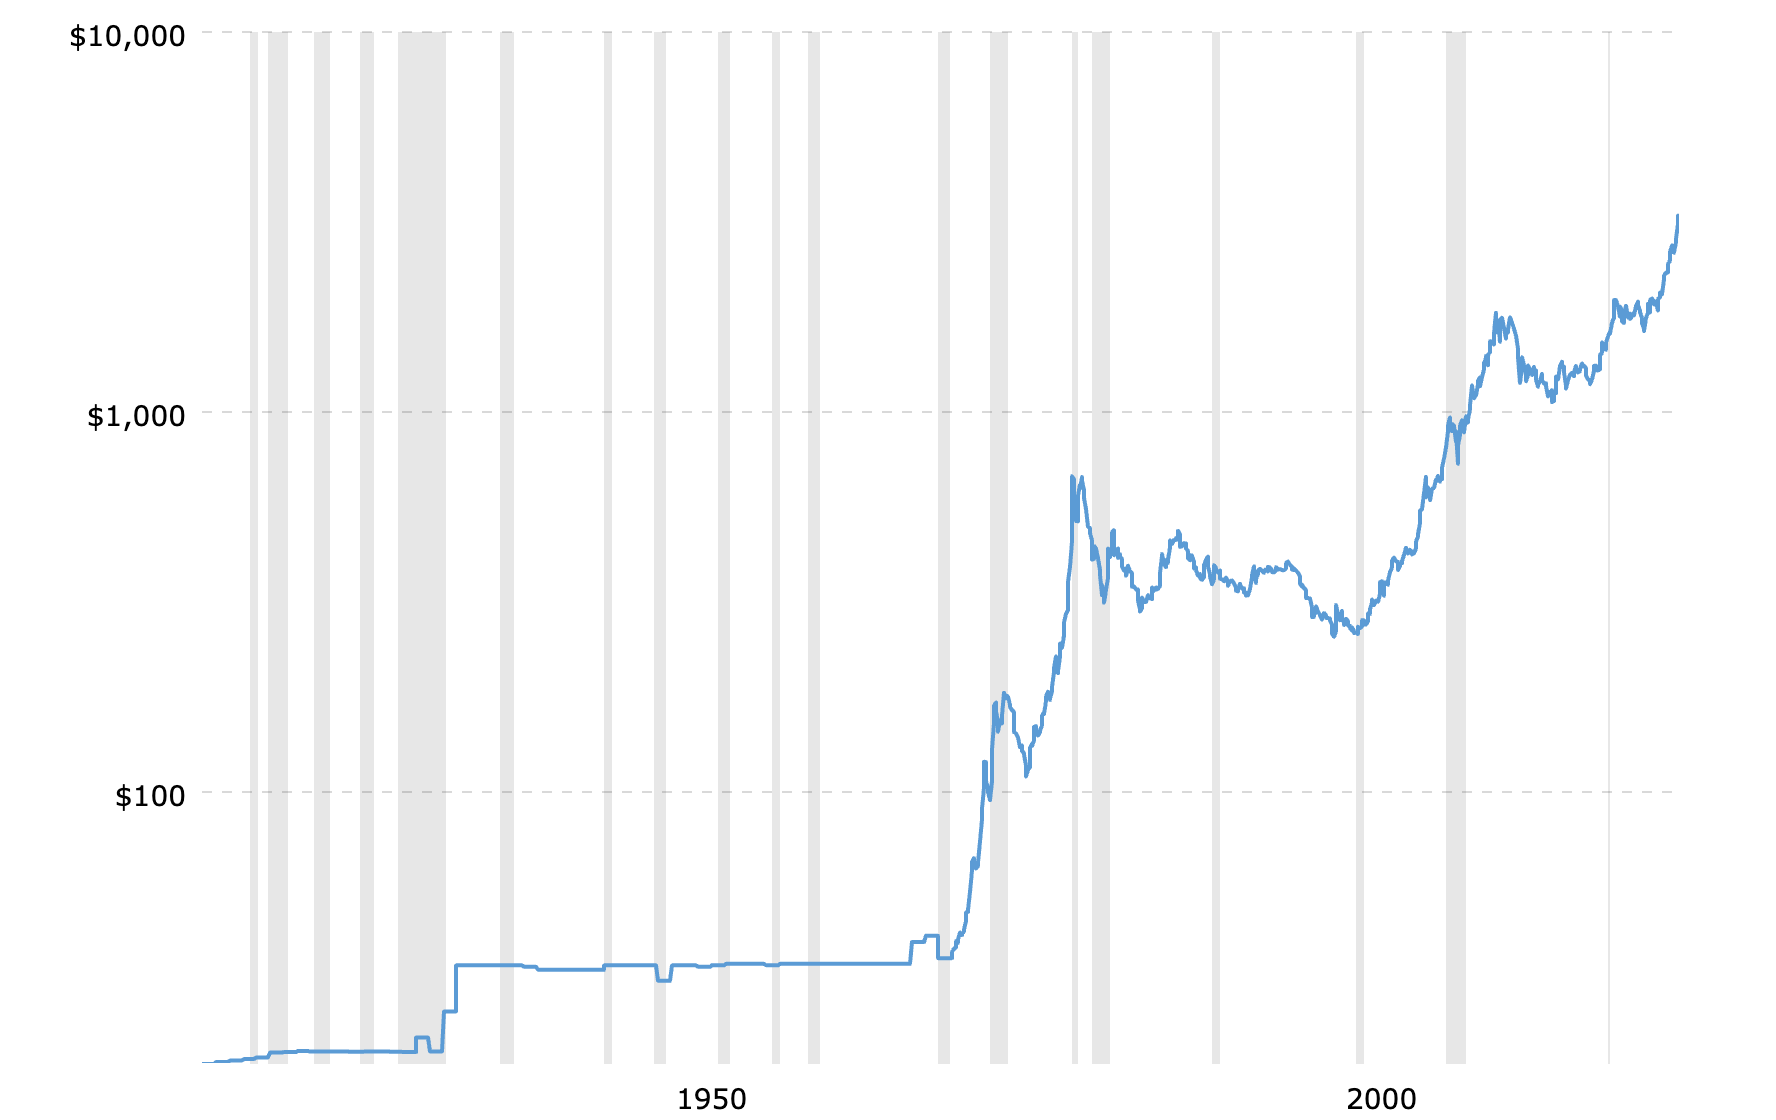
This logic also applies to other goods: oil, real estate (per square meter), and so on.
Conclusion: What Does Wealth Really Mean?
Real wealth isn’t a number in your tax return or online bank account — it’s what you can actually afford in real resources: housing, food, experiences, travel, comfort, freedom.
When I translated my net worth into equivalents like gold, oil, or square meters of housing, I realized that over the past 10 years, my nettoformue hasn’t shown consistent growth. On the contrary — on a timeline, the movement is mostly sideways, with occasional spikes but also noticeable drawdowns. It’s a sobering realization.
So should we rely on “formal” wealth — the kind calculated annually by Skatteetaten? Yes — it’s a useful and objective source that reflects the structure of your assets and liabilities. But it shouldn’t be the end of the analysis.
It’s just as important to go deeper: to examine what your capital is made of — and what real opportunities it gives you in a constantly shifting world.
How to Protect Your Real Wealth
I consider myself a long-term investor, and my main principle is risk management.
In times of uncertainty, inflation, and currency volatility, the goal isn’t to chase quick returns — it’s to build resilience.
To do that, I believe these points are essential:
- Invest in your own knowledge — without that, everything else loses meaning.
- Diversify your capital — don’t put all your eggs in one basket.
- Hold assets that aren’t tied to a single national currency — gold, silver, and other precious metals.
- Have exposure to the energy sector — oil, gas, and possibly new forms of energy generation.
- Invest in real estate — especially properties that hold value across economic cycles.
- Don’t forget liquidity and cash — especially during unstable periods.
The formal numbers are just surface-level. Real wealth is about freedom, optionality, and resilience in the face of shocks.
It was truly useful for me to view my financial situation from a new angle — through the lens of real assets and tangible goods. It gives you something to think about — and helps realign your goals.